Lifelong learning
Many of the next generation of older adults will have more formal education than today’s older adults. This section starts by discussing the educational profile of today’s older adults. This is followed by a discussion of literacy levels and job-related training, all of which may have an impact on older adults' participation in the workforce.
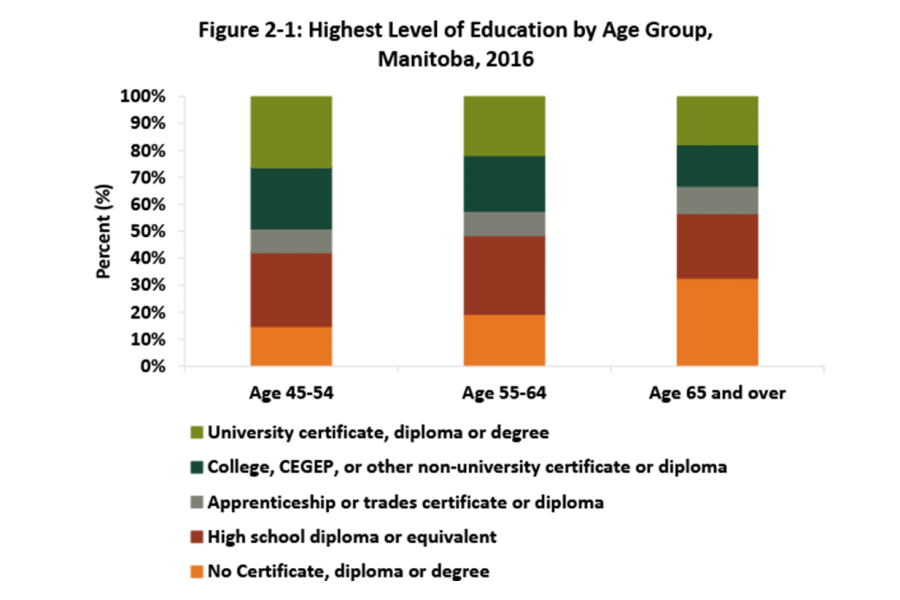
Educational attainment
Download file
Highest level education (PowerPoint) | Highest level education (Excel)
Note: This data source is based on the 2016 Census long-form questionnaire. A sample of approximately 25% of Canadian households received a long-form questionnaire.
Source: Statistics Canada. 2017. Highest Certificate, Diploma or Degree (15), Major Field of Study - Classification of Instructional Programs (CIP) 2016 (14), School Attendance (3), Age (13A) and Sex (3) for the Population Aged 15 Years and Over in Private Households of Canada, Provinces and Territories, Census Divisions and Census Subdivisions, 2016 Census - 25% Sample Data. 2016 Census of Population. Statistics Canada catalogue no. 98-400-X2016242. Ottawa. Released November 29, 2017.

Download file
Highest level of education 65+ (PowerPoint) | Highest level of education 65+ (Excel)
Note: This data source is based on the 2016 Census long-form questionnaire. A sample of approximately 25% of Canadian households received a long-form questionnaire.
Source: Statistics Canada. 2017. Highest Certificate, Diploma or Degree (15), Major Field of Study - Classification of Instructional Programs (CIP) 2016 (14), School Attendance (3), Age (13A) and Sex (3) for the Population Aged 15 Years and Over in Private Households of Canada, Provinces and Territories, Census Divisions and Census Subdivisions, 2016 Census - 25% Sample Data. 2016 Census of Population. Statistics Canada catalogue no. 98-400-X2016242. Ottawa. Released November 29, 2017.
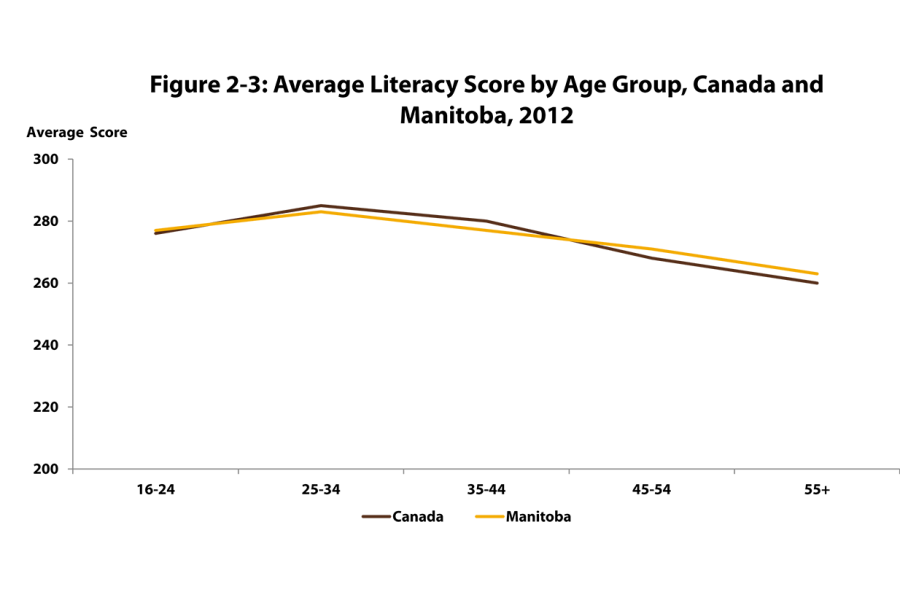
Literacy
Download file
Literacy score (PowerPoint) | Literacy score (Excel)
Note: Higher literacy scores equal higher levels of literacy
Source: Organization for Economic Cooperation and Development (OECD), Program for the International Assessment of Adult Competencies (PIAAC), 2012 Literacy Assessment.
Download file
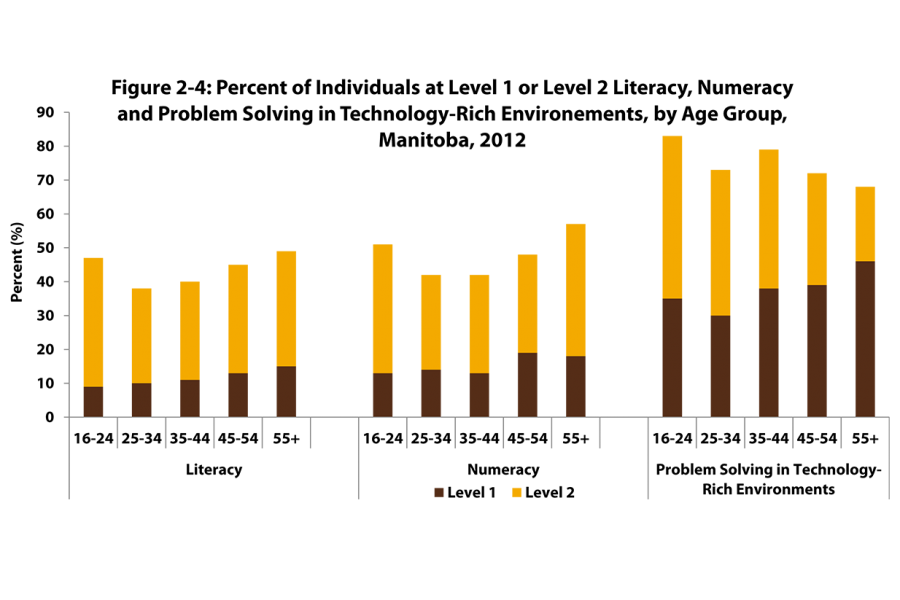
Literacy level 1 or level 2 (PowerPoint) | Literacy level 1 or level 2 (Excel)
Source: Organization for Economic Cooperation and Development (OECD), Program for the International Assessment of Adult Competencies (PIAAC), 2012 Problem solving Assessment.
NOTE: Level 1 indicates a lower level of ability in literacy, numeracy and problem solving in technology-rich environments than level 2.
For more detailed information about proficiency levels see: OECD (2016), The survey of adult skills: Reader’s companion, Second Edition, OECD Skills Studies, OECD Publishing, Paris.
Download file
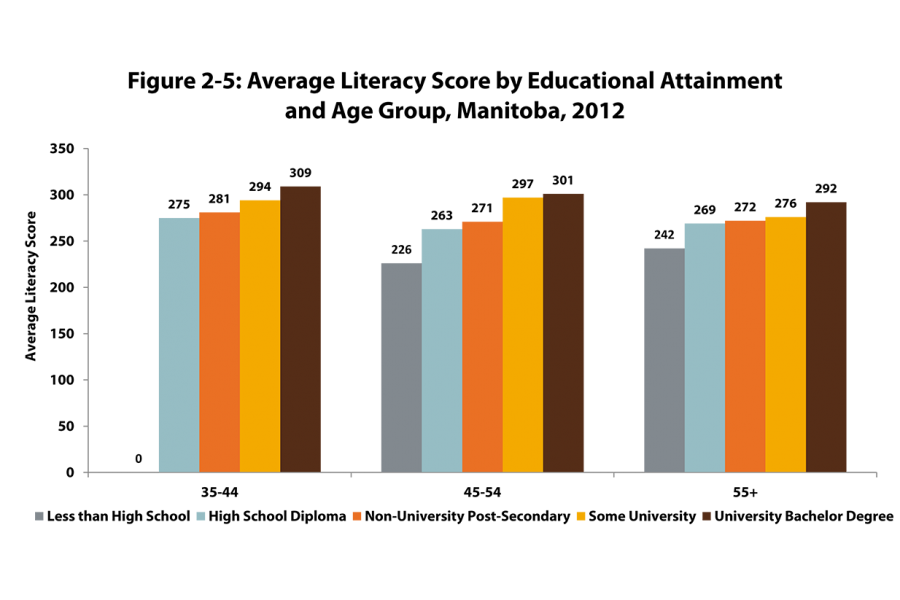
Literacy score by educational attainment (PowerPoint) | Literacy score by educational attainment (Excel)
Source: Organization for Economic Cooperation and Development (OECD), Program for the International Assessment of Adult Competencies (PIAAC), 2012 Literacy Assessment.
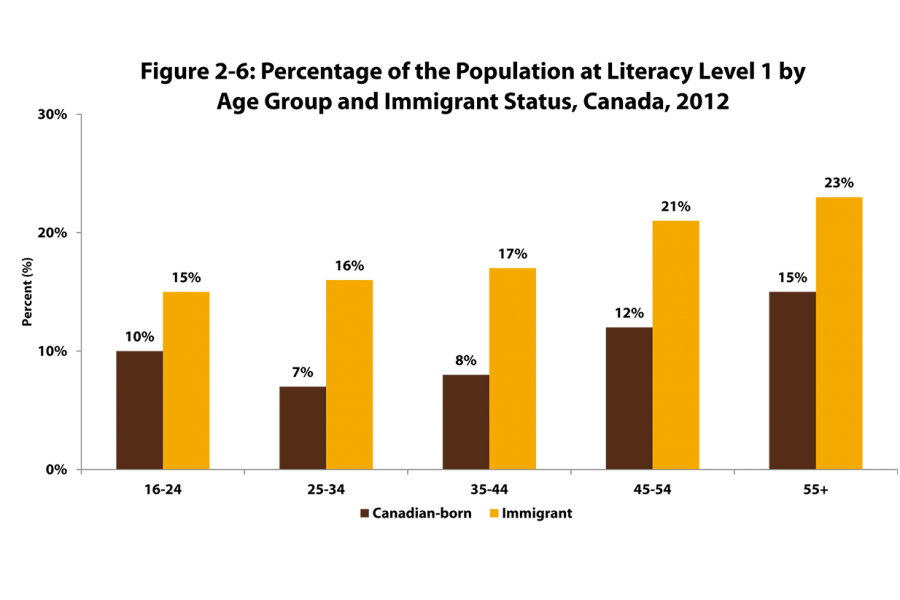
Download file
Literacy level 1 immigrants and Canadian born (PowerPoint) | Literacy level 1 immigrants and Canadian born (Excel)
Source: Organization for Economic Cooperation and Development (OECD), Program for the International Assessment of Adult Competencies (PIAAC), 2012 Literacy Assessment.
NOTE: Level 1 indicates a lower level of ability in literacy, numeracy and problem solving in technology-rich environments than level 2.
For more detailed information about proficiency levels see: OECD (2016), The survey of adult skills: Reader’s companion, Second Edition, OECD Skills Studies, OECD Publishing, Paris.
Use of technology
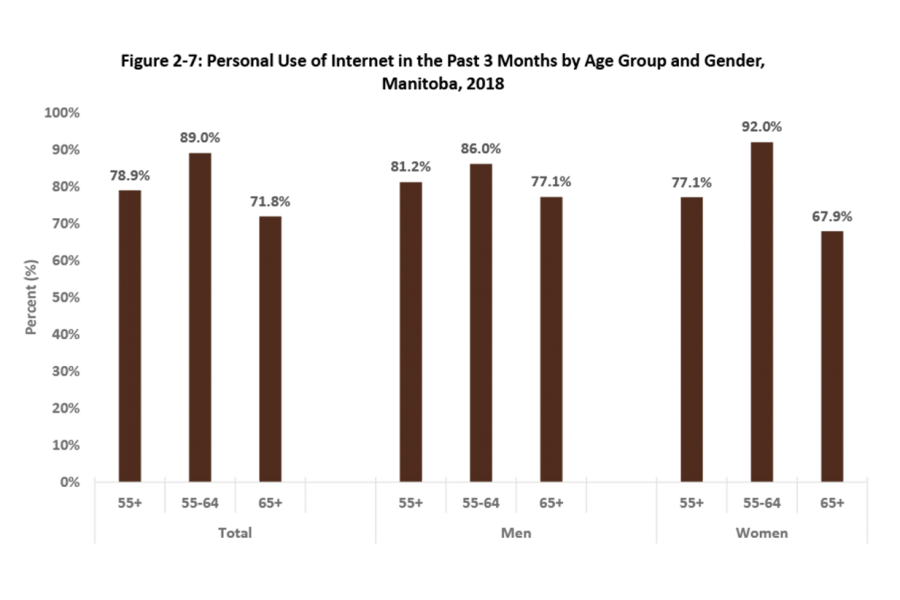
Download file
Internet use (PowerPoint) | Internet use (Excel)
Source: Statistics Canada. 2018. Canadian Internet Use Survey, Public Use Microdata File.
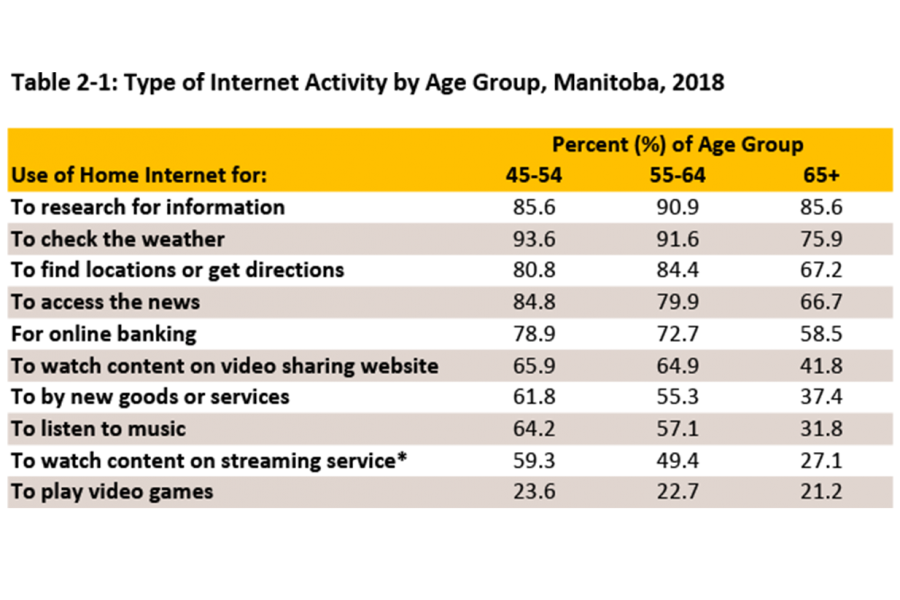
Download file
Internet activity (PowerPoint)
*Not including live television
Source: Statistics Canada. 2018. Canadian Internet Use Survey, Public Use Microdata File.
Job related training
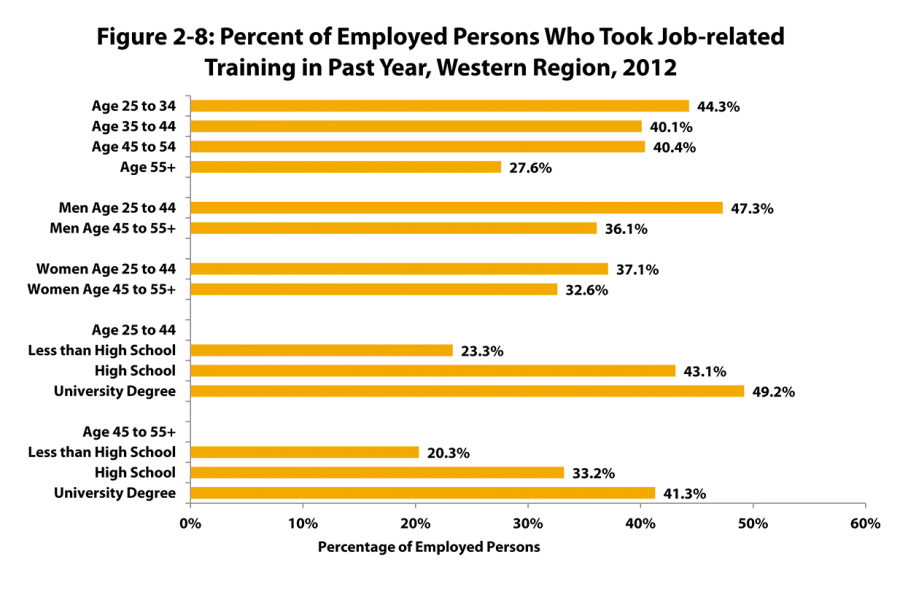
Download file
Job related training (PowerPoint)
Source: Figure 2-8 Statistics Canada, Program for the International Assessment of Adult Competencies, 2012, Public Use Microdata File.
Information about the Program for International Assessment of Adult Competencies (data available separately)
Download file
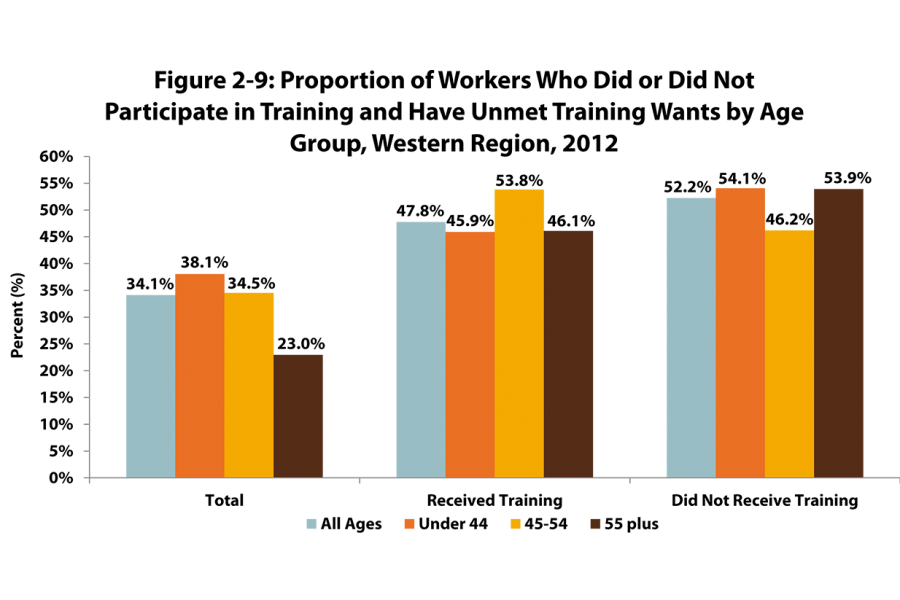
Workers unmet training (PowerPoint) | Workers unmet training (Excel)
Source: Figure 2-9 Statistics Canada, Program for the International Assessment of Adult Competencies, 2012, Public Use Microdata File.
Information about the Program for International Assessment of Adult Competencies (data available separately)
Download file
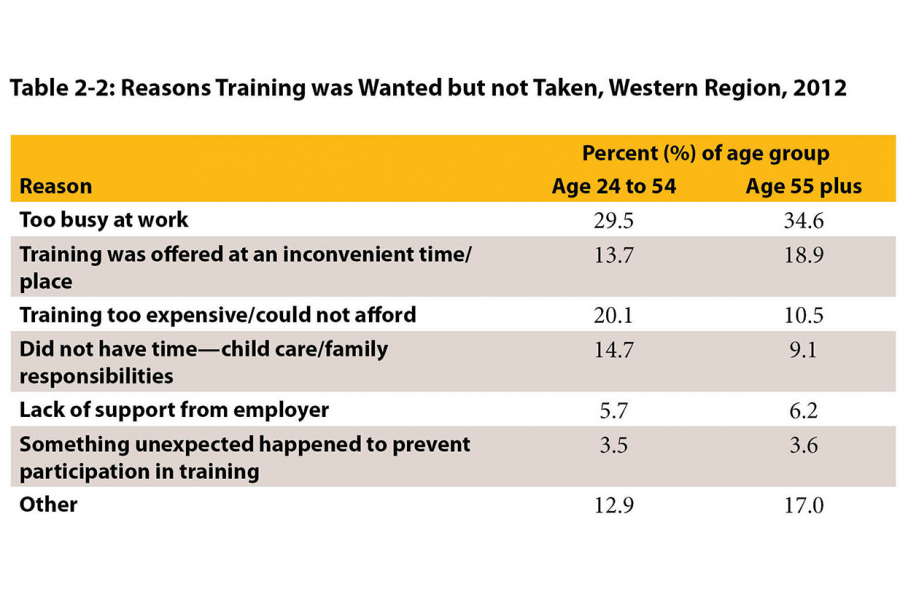
Training not taken (PowerPoint)
Source: Tables 2-2 Statistics Canada, Program for the International Assessment of Adult Competencies, 2012, Public Use Microdata File.
Information about the Program for International Assessment of Adult Competencies (data available separately).
Download file
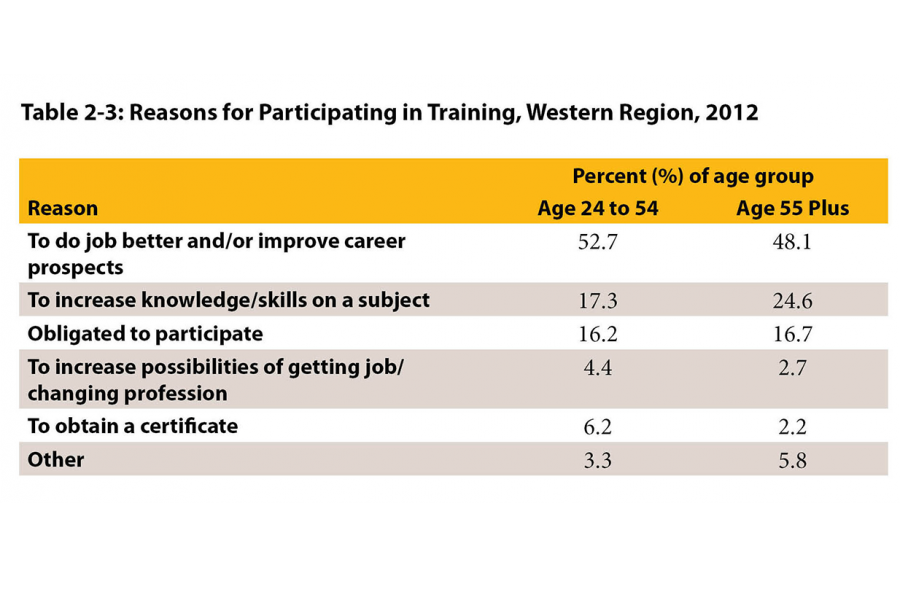
Training participation (PowerPoint)
Source: Tables 2-3 Statistics Canada, Program for the International Assessment of Adult Competencies, 2012, Public Use Microdata File.
Information about the Program for International Assessment of Adult Competencies (data available separately).
Download file
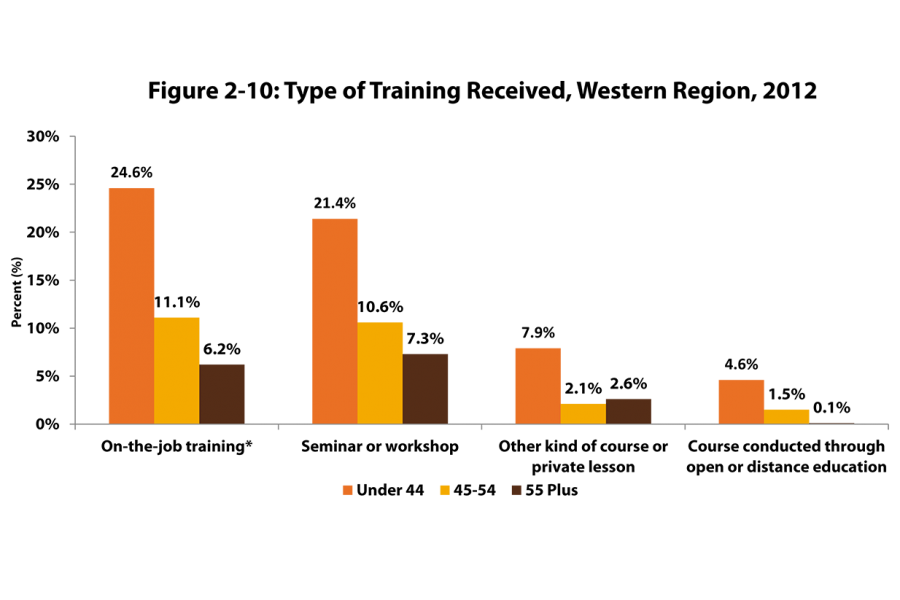
Training received (PowerPoint) | Training received (Excel)
*training by supervisors or co-workers
Source: Statistics Canada, Program for the International Assessment of Adult Competencies, 2012, Public Use Microdata File.
Information about the Program for International Assessment of Adult Competencies (data available separately).