
BRUNKILD TORNADO EVENT
24 JULY 2000
An example of tornadogenesis
in a low shear multicell storm environment
over southern Manitoba, Canada
Michel J. R. Bisson, Rob Paola
Meteorological Service of Canada
Prairie Storm Predication Centre, Winnipeg, Manitoba, Canada
1. INTRODUCTION
During the afternoon of 24 July 2000, several thunderstorms developed along a trough of low pressure over southern Manitoba and persisted into the evening. Radar data showed a line of strong thunderstorm cells forming in the same environment, very close to one another, moving very slowly northeastward before dissipating. New redevelopment often occurred on the southwest flank of the storms. Multiple funnel clouds and tornadoes were observed from several of these cells, as well as large hail and strong winds (see Special Weather Statement). The largest of these was a multivortex tornado which formed near Brunkild, a small farming community 30 minutes southwest of the city of Winnipeg. The tornado touched down at 6:10 PM CDT (2310 UTC) and was on the ground for approximately 10 minutes, moving very slowly and erratically. No damage was reported as it moved across open fields, earning it an F0 rating. However, its size and appearance suggested the possibility of a more damaging tornado (Figure 1).
With a warm moist airmass over southern Manitoba, cool air aloft, and a sharp surface trough moving into the area, forecasters at the Prairie Storm Prediction Centre (PSPC) in Winnipeg, MB were well aware of the potential for severe weather. The first Severe Thunderstorm Watch was issued at 12:36 PM CDT for most of southern Manitoba to alert the public of the possibility of severe weather, with warnings following 4 hours later. The storm was tracked by both the Vivian conventional radar (WVJ - decommissioned in 2001) and Woodlands Doppler radar (XWL). Radar data was also analyzed using Environment Canada's Radar Decision Support System (RDSS), a knowledge-based expert system which dissects volumetric weather reflectivity data to identify critical storm features. This paper will focus on the radar data obtained during the course of the storm and the evolution of low-level wind fields that played a role in developing supercells and tornadoes on this day. Both the reflectivity data and RDSS output will be analyzed showing the evolution of radar signatures and parameters associated with these supercells.
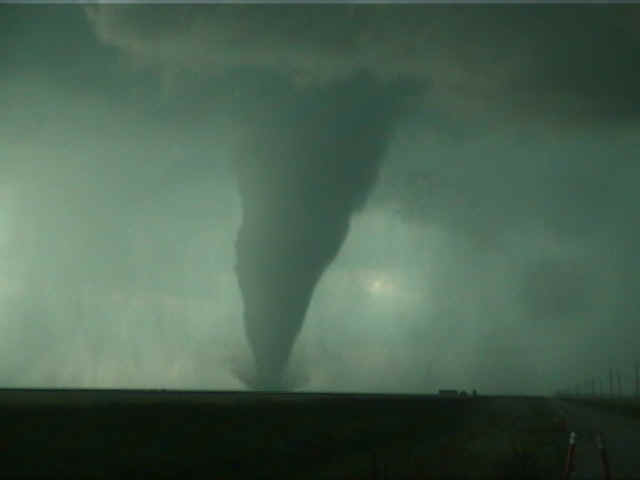
Figure 1: Photograph of the 24 July 2000 Brunkild tornado
(Courtesy of Pat McCarthy, Environment Canada)
Figure 2: Location of the various funnel clouds and tornadoes which occurred in the Elm Creek and Brunkild areas. Brunkild is located southwest of Winnipeg on Highway 3. |
 |
Time (CDT) |
Location |
4:22 p.m. |
tornado north of Elm Creek |
5:19 p.m. |
tornado 3 km north of Brookdale (south of Neepawa) |
5:30 p.m. |
tornado approximately 10 km west-southwest of Neepawa, funnel clouds in Brookdale area. |
5:50 p.m. |
2nd tornado west of Neepawa |
6:08 p.m. |
tornado south of Plum Coulee |
6:10 p.m. |
tornado on ground 8 km west of Brunkild and 12 km south of Elm Creek. |
6:11 p.m. |
tornado east of Carman |
6:15 p.m. |
multiple-vortex tornado 5 km west of Brunkild. |
6:19 p.m. |
Brunkild tornado dissipating. |
Table 1. Confirmed tornadoes on 24 July 2000
2. SYNOPTIC SITUATION AND SEVERE THUNDERSTORM
ASSESSMENT
Figure 3: Surface Analysis from 1800 UTC 24 July 2000.
Surface Features:
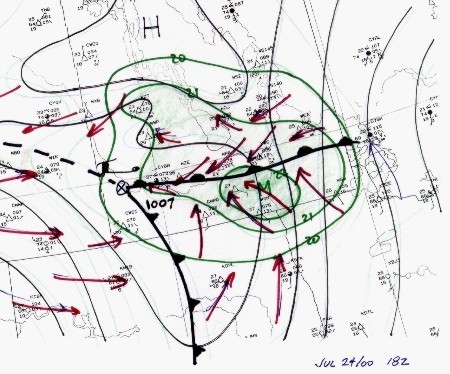
On the morning of 24 July, a 1007 mb surface low was analyzed near Saskatoon, SK, with a
frontal wave extending into southeastern Saskatchewan near Estevan. During the evening and night of
July 23rd, scattered thunderstorms, some severe, occurred in southern Saskatchewan
associated with this low and trough. By early afternoon (1800 UTC), this frontal
trough had moved into southwestern Manitoba with a new 1007 mb low forming 30 km west of
Brandon, MB and warm frontal trough running eastward to just south of Winnipeg (see Figure 3).
Surface temperatures in the warm sector climbed to 27°C with very high dew points (Td) of
21-22°C. Low-level convergence in the boundary layer was evident along the trough with a
northeasterly flow north of the trough and southeast flow south of the trough. A moisture
axis was observed in the warm sector over the Red River Valley ahead of the surace low
then northwestward into Saskatchewan. At 2100 UTC the surface low
was east of Brandon and thunderstorms and funnel clouds had been reported southeast of
Portage La Prairie, MB. By evening (0000 UTC 25 July) the low
had deepened to 1004 mb and moved to lie just west of Winnipeg with the warm front
eastward, cold front southwestward through Gretna, MB and surface trough to just south of
Brandon then westward. The most severe storms formed along the boundary of the surface
trough.
Upper Features:
At 1200 UTC 24 July the 500 mb height/vorticity fields showed an upper
low over western Saskatchewan west of North Battleford with a weak upper ridge over southern Manitoba.
500 mb winds were generally 25 knots or less over southern Manitoba throughout this event with
no dramatic height falls noted aloft. This would suggest no further destabilization of the
airmass already in place (which was already very unstable). The 700 mb analysis
showed a weak southwest flow aloft over southern Manitoba with west-southwest winds of 15 knots
ahead of a 700 mb low over west-central Saskatchewan. The 850 mb analysis
showed a low near North Battleford with a trough line extending southeastward into the Dakotas
putting southern Manitoba in a weak south to southwest flow at 850 mb. Sounding data was not
available from the upper air station at Shilo, MB(WLO) in southwestern Manitoba near Brandon.
Data from this station might have given some important input into the vertical wind profile
ahead of the approaching trough that day.
By the evening of the 24th (0000 UTC 25 July), the 850 mb low
was analyzed over southwestern Manitoba near Brandon, thanks to upper air data from the ballon releases in Winnipeg that day.
The analysis revealed a tighter gradient ahead of the upper low than the models were suggesting.
The operational 35-km Global Environmental Multiscale (GEM) model from CMC in Montreal was
indicating significant lift at 700 mb developing over southern Manitoba, possibly induced by convective feedback.
The 850 mb thermal ridge wrapped just ahead of the surface low. GEM model guidance also depicted that
Lifted Index (LI) values were running from -6 to -9°C with convective
available potential energy values (CAPES) of 2500 to 3000 Jkg-1 over southern Manitoba.
Showalter Index (SI) values were running from 0 to -4 with a SWEAT Index of greater than 250
for the area. Shear, although present, was not overly impressive as the main mid/upper level
jet was over the Dakotas with a low-level jet towards the Great Lakes. Winds in the 0-6 km levels
over southern Manitoba were generally 25 knots or lower with low-level winds (0-2 km) in the 5
to 15 knot range. This low shear/high CAPE environment would indicate pulse-type convection,
briefly severe in some localities, with large hail and heavy rain being the main threats.
Tornado risk would be considered minimal given the low shear profiles.
Figures 4(a) and 4(b) show the upper air sounding obtained at Winnipeg (XWI) from an intermediate balloon release at 1800 UTC on 24 July. The sounding indicated very unstable conditions with a surface temperature of 27° C and dewpoint of 20° C giving CAPE values of 3000 Jkg-1 and LI values of -10° C. The corresponding hodograph continued to show a low shear environment with winds of 15 knots or less in the lowest 2 km (6,000 feet) and 25 knots or less below 6 km (20,000 feet).
|
|
| (a) | (b) |
| Figure 4: 1800 UTC Tephigram and hodograph from Winnipeg (XWI). (click images to enlarge) |
|
This low shear
environment however began to change during the course of the afternoon as the surface low
and trough approached from the west. A second radiosonde release from Winnipeg, at
2100 UTC, showed that the winds in the lowest 2 km (6,000 feet)
had increased to 15 to 20 knots from the south-southeast, indicating the development
or intensification of a low-level jet ahead of the surface trough. This sounding also showed winds
decreasing to about 10 knots at the 700 mb level (10,000 feet). At the time of the Brunkild storm,
around 2300 UTC, the Woodlands Doppler Velocity Azimuth Display (VAD)
indicated the presence of a strengthening low-level jet just above the surface. This was confirmed by
the 0.5° Radial velocity image, which displayed a south-southeast
low-level jet of 35 to 40 knots at about 1000 feet. The VAD image also confirmed light
winds at the 2.5-3 km level (8-10k feet), but also showed stronger winds of 40 knots from the
southwest at 4 km (13,000 feet) Thus, the low-level wind profile over the Brunkild
area changed substantially between 18-23 UTC from a benign low shear environment, to a
more substantial shear environment. High-resolution
GEM model data (4-km at 35-eta levels) from 1200 UTC showed the development of a southerly low-level jet of 30 knots just ahead of the surface
trough between 1800 UTC 24 July and 0300 UTC 25 July (see model animation). The operational 35-km GEM model (28-eta levels) depictions from 1200 UTC did
not catch the intensification of this low-level jet over southern Manitoba. In fact, it
actually weakened the southerly low-level jet from 20 knots over southwestern Manitoba at
1800 UTC to 10 knots over southeastern
Manitoba by 0000 UTC 25 July. Thus, the high-resolution model performed much better in predicting
low-level wind profiles and the intensification of the low-level jet, an important factor
in the development of the severe thunderstorms for that day.
3. RADAR DATA The Vivian radar is a WSR-81 C-Band conventional
radar. The radar’s beam-width is 1.1° with the data recorded in 1 km length bins for
every elevation angle for the first 120 km radial range and 2 km length bins from 120 to
240 km radial range. Within every 5 minutes, 360° scans of reflectivity data are made at
24 different elevation angles ranging from 0.5° to 30° (see Erfani, 1999 for details).
The Woodlands Doppler radar was commissioned in early spring 2000 as part of the National
Doppler Radar Network. The reflectivity volume data set can be further processed for
operational forecasters by RDSS. The output from RDSS displays critical reflectivity
storm-related features (e.g. gradients, echo tops, vertically integrated liquid or VIL,
VIL density, weak echo regions), to help identify which cells exhibit possible severe
storm structure. (See Dudley et al, 1998 and Keck et al, 1996, for additional information
on RDSS.) Forecasters can use this combination of conventional and Doppler radar as
well as RDSS output to help in assessing thunderstorm structure and severity. (a) (b) 4. STORM EVOLUTION Radar images
indicated that most of the storms that developed that day were pulse-like in nature,
growing and decaying within 30 to 60 minute cycles, but initiating new storms about 10-20
km away directly in the downwind direction, usually along the trough. The Brunkild storm
initially formed at 2000 UTC approximately 90 km west-southwest of the Vivian radar and 60
km south of the Woodlands radar. The storm complex remained quasi-stationary as it
intensified and decayed, with redevelopment occurring on its southwest flank. Then, at
2300 UTC, the storm began to track slowly southeastward (e.g. a right-mover) and exhibited
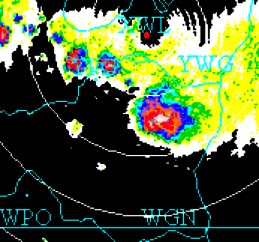
some characteristics of a "classic" supercell. Figure 5 shows the low-level (1.5
km) and hi-level (7.0 km) CAPPI images from 2310 UTC, the approximate time of the tornado
touchdown. The storm has a single cell structure with a large, intense core (> 55 dBZ);
a tight reflectivity gradient on the southwest flank indicative of a strong inflow; strong
updraft; a bounded weak echo region (BWER); storm tops greater than 16 km (53,000 feet)
overhanging a low-level reflectivity gradient area; and a "V"-notch downwind
structure indicative of the environmental air flowing into the core of the storm. At 2250 UTC the low-level
reflectivity radar echoes began to elongate, and 5 minutes later a V-notch appreared on the
hi-level image over the southwest side of the storm. Inflow notch and tail are evident in the
images with a strong reflectivity gradient on the southwest flank. A hook first appears at 2300 UTC.
At 2310 UTC the inflow and hook were still evident, although the gradient was not as sharp.
The strongest echoes were more centred as opposed to being close to the edge. By 2320 UTC
the hook is disappearing and storm reformation begins to occur to the east (new strong echoes appear).
Vivian 1.5 km radar image sequence shows echoes forming
and drifting slowly eastward then dissipating, all within a 30 km area before it finally begins to move
southeastward at 2335 UTC. CAPPI TOP radar images show cloud tops were uniform up to 2235
UTC, building to greater than 16 km by 2250 UTC then collapsing to less than 14 km by 2350
UTC. The Woodlands
Doppler radar 0.5 degree elevation Radial Velocity image sequence indicates a rotation
couplet of 12-15 ms-1 (23-35 knots) moving from east of Elm Creek at 2240 UTC to west of
Brunkild by 2330 UTC. The Mesocyclone detection algorithm was detecting mesocyclones
throughout the afternoon.
Although no mesocyclones were indicated at 2310 UTC, the time of the tornado touchdown,
the following image (2320 UTC) painted 4 circles around various portions of the cell. 4.1 RDSS Output
Figure
5: 1.5 km and 7.0 km CAPPI images from the Woodlands radar (XWL)
showing the Brunkild storm cell at the time of the tornado touchdown
(2310 UTC).
A sample of RDSS output
shows a variety of reflectivity structures at 10-minute intervals. The
vertical
profile view indicated that a cell was collapsing between 2230 and 2240
UTC and that a new
cell, the storm complex which spawned the Brunkild tornado, began to
develop after 2240 UTC west of the initial cell.
The cell is upright or slightly tilted downshear at this time. Ten
minutes later a hook echo becomes apparent with a V-notch also
appearing in the gradient display. By 2300 UTC a bounded weak echo
region (BWER) appears on the southwest flank of the cell at 177
degrees 57 km and the reflectivity gradient was very strong on the
southwest and west
sides of the storm (see Figures 6(a) and 6(b)). The vertical
cross-section profile of 2310 UTC and 2320 UTC indicates that the cell
is in its dissipation stage, with the final collapse occurring after
2320 UTC, at which
time the BWER disappears. Echo Tops were over 15 km and VIL density
remained at values
greater than 4.5 gm-3 throughout the episode. Maximum reflectivity (Max_R)
products showed that maximum reflectivities had increased just before the tornado was
spawned and stayed at 12-15 km afterwards.
(a)
(b)
Figure 6: RDSS BWER and Gradient views of the Brunkild storm from 2300 UTC.
4.2 Satellite Analysis
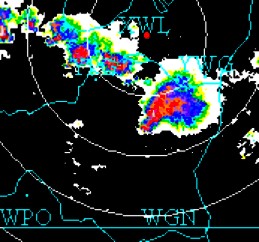
The GOES-8 Visible satellite image at 2310 UTC (5 PM CDT) shows a band of thunderstorms along the surface trough from Brunkild northwestward. The Brunkild storm was located at the southern end of the line of main thunderstorm activity, although a few thunderstorms did develop along the trough to the east. (see Figure 7). Overshooting tops are clearly visible, with generally dry air over the Brandon region and cumulus fields over Red River and Whiteshell regions, indicating where the supply of moisture is coming from. An outflow boundary is visible to the southwest of the Brunkild storm, indicating the rear flank downdraft (RFD) has initiated and a cutoff of the moisture supply is imminent. Another low-level boundary, possibly due to the approaching front, is seen moving eastward from the Brandon region, with drier air in behind it.
Figure 7: GOES-8 visible satellite image
of thunderstorm activity over southern Manitoba at 2310 UTC. (click image for loop)
5. SUMMARY
With a warm moist airmass over southern Manitoba, cool air aloft, and a sharp trough moving through the region, conditions were favourable for the development of severe thunderstorms over southern Manitoba during the afternoon of 24 July 2000. The only missing ingredient on this day was the lack of significant wind shear to develop strong long-lived supercells. The overall synoptic pattern suggested a low shear/high CAPE storm environment favourable to pulse-type or multi-cellular severe thunderstorms. Nonetheless, with the very unstable conditions in place and high CAPE available, there was enough low-level shear that developed late in the afternoon to generate some short-lived supercells and several tornadoes over southern Manitoba that day. Radar data obtained during the course of the Brunkild storm indicated that it had some characteristics of a "classic" supercell. RDSS output worked well at detecting and assessing severe storm parameters.
Of particular
importance in this case was the role of a strengthening low-level jet over southern
Manitoba and its contribution to the development of several short-lived supercells capable
of spawning tornadoes. This case demonstrates the importance of monitoring low-level
windshear in a high CAPE environment and the danger in relying on synoptic scale model
data to assess mesoscale parameters. Doppler radar, mesoscale modelling, surface data and
knowledge of local topographical effects can give valuable insight into the development or
strengthening of low-level winds and associated shear. Given enough CAPE, this increased
shear can lead to elevated severe weather potential and tornado risk.
6. ACKNOWLEDGEMENTS
The authors would like to thank Amin Erfani, Meteorologist (PSPC), for his helpful advice and insight in high-resolution modelling. Thanks also to Pat McCarthy, Program Manager (PSPC), for his advice and comments on this paper (and the great photo!).
7. REFERENCES
Doswell, Charles A., 1996: What is a Supercell? [Position paper for a panel discussion]. NOAA/ERL National Severe Storms Lab. Appeared in Preprints, 18th AMS Conference Severe Local Storms, San Francisco, CA. 19-23 Feb 1996, AMS p. 641.
Dudley, D., McCarthy, P., 1998: Severe thunderstorm analysis and detection using RDSS. Preprints, 19th Conference on Severe Local Storms, Minneapolis, MN, Amer. Meteor. Soc., Boston, 595-598.
Erfani, A., 1999: The Winnipeg Hailstorm of 16 July 1996: Synoptic Analysis and Radar Observations. M.Sc. thesis, University of Alberta, Edmonton, Alberta, Canada, 127 pp.
Erfani, A., McCarthy, P., 2000: Multiple Bounded Weak Echo Regions in the 16 July 1996 Winnipeg, Manitoba, Canada, Hailstorm Supercell. Presented at SELS conference September 2000. Prairie Storm Prediction Centre, Winnipeg, Manitoba.
Keck, A., Legal, L., 1996: A radar decision support system for the automated recognition of summer severe weather features. Preprints, 18th Conference on Severe Local Storms, San Francisco, CA, Amer. Meteor. Soc., Boston, 609-612.