Financial well-being
It is well recognized that income is directly associated with an individual’s health. Furthermore, income is the basis of one’s ability to obtain adequate housing, to access transportation, to buy nutritious food and enough food to maintain health, and to access non-insured health services such as medication. We examine the financial characteristics of older adults using a variety of available measures. Comparisons to younger age groups and by gender will be made when possible.
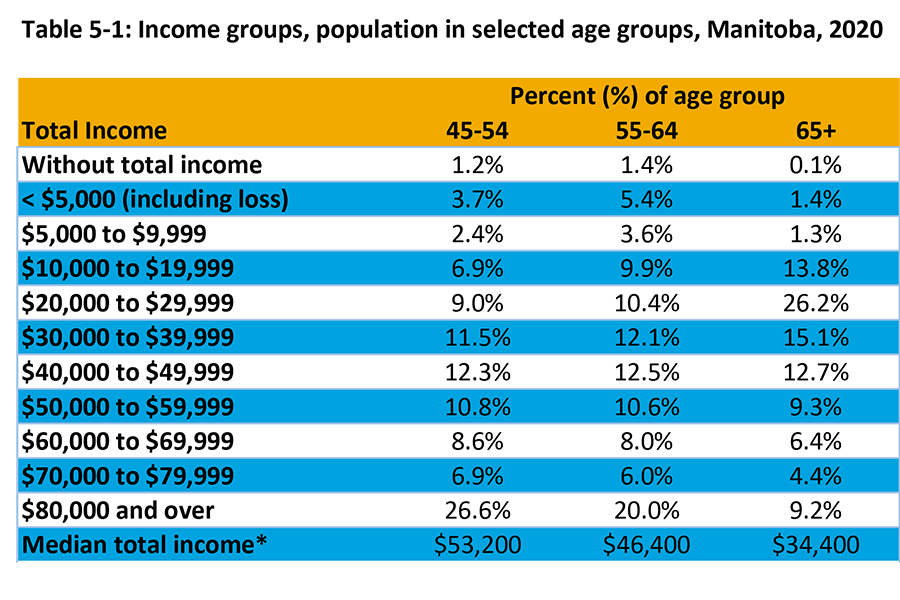
Income levels
Download file
Select income levels (PowerPoint)
*Median income divides the income distribution in half.
Source: Statistics Canada. Table 98-10-0064-01
Total income groups by age and gender: Canada, provinces and territories, census metropolitan areas and census agglomerations with parts.
Download file
Income older Manitobans (PowerPoint) | Income older Manitobans (Excel)
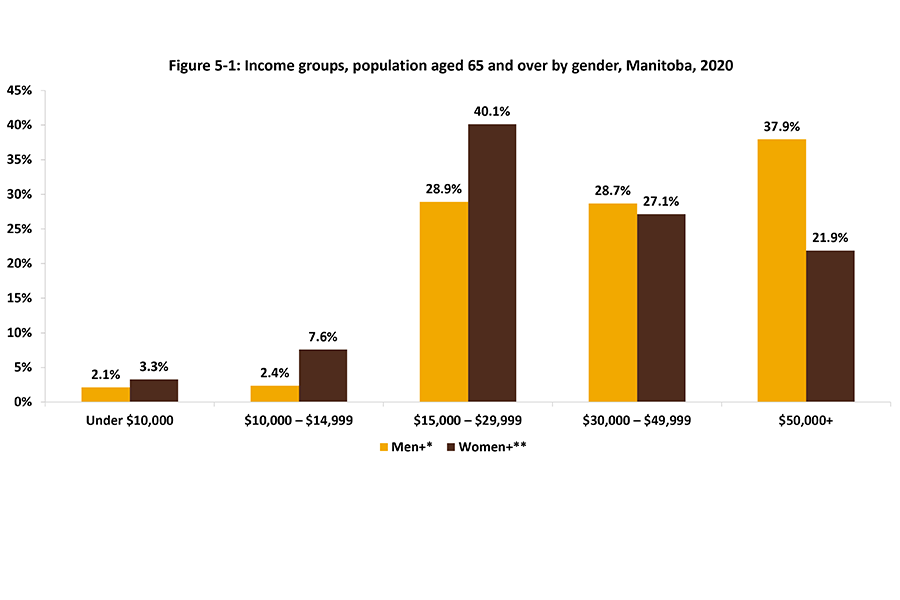
*This category includes men (and/or boys), as well as some non-binary persons.
**This category includes women (and/or girls), as well as some non-binary persons.
Source: Statistics Canada. Table 98-10-0064-01
Total income groups by age and gender: Canada, provinces and territories, census metropolitan areas and census agglomerations with parts.
Download file
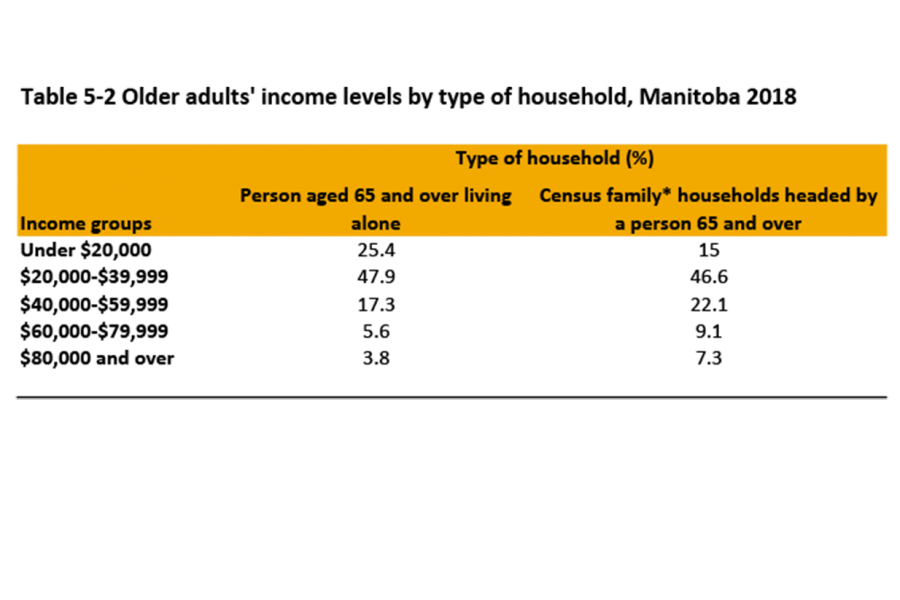
Older adults income level (PowerPoint)
Source: Statistics Canada. 2018. Canadian Community Health Survey, Public Use Microdata File.
Download file
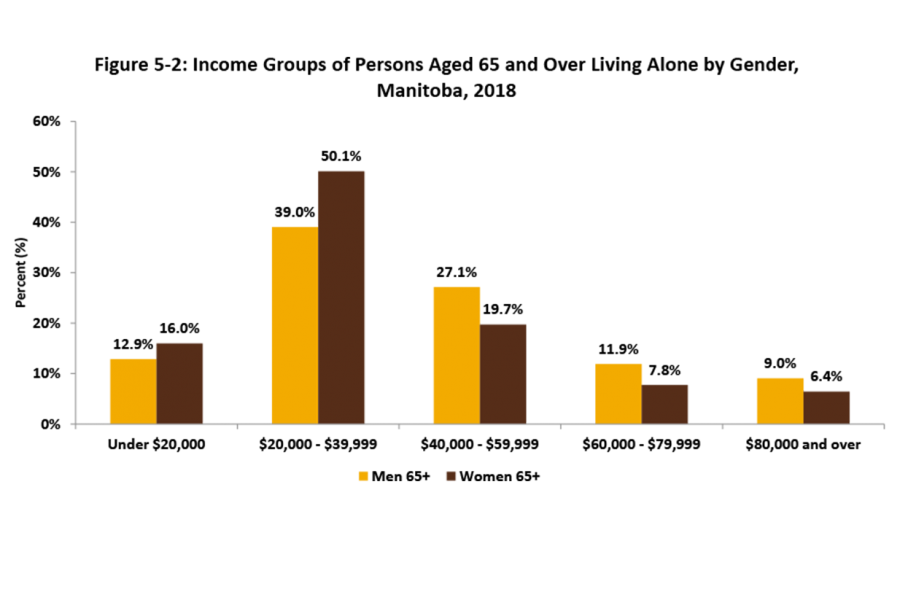
Income older Manitobans living alone (PowerPoint) | Income older Manitobans living alone (Excel)
Source: Statistics Canada. 2018. Canadian Community Health Survey, Public Use Microdata File.
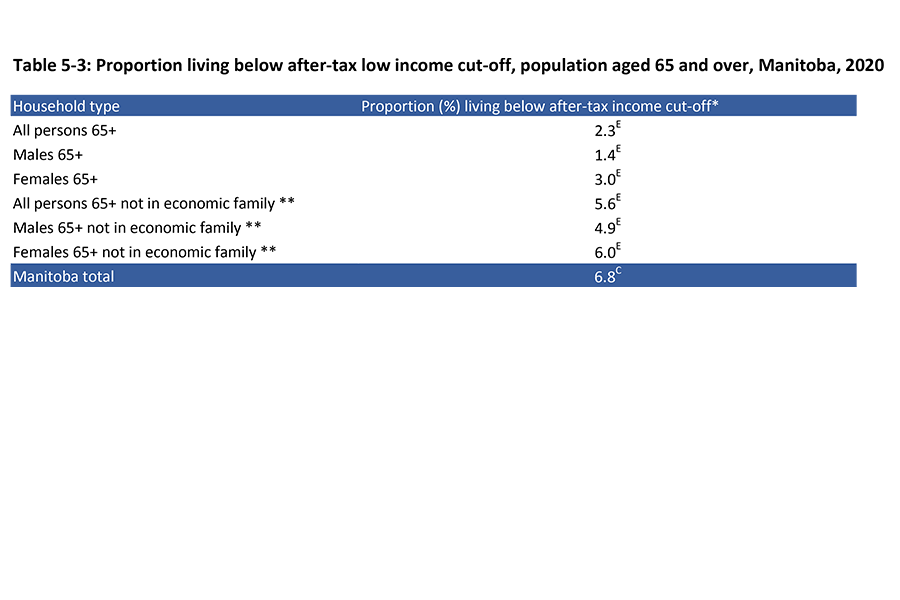
Low income older adults
Download file
Low income cut off (PowerPoint)
E: use with caution
C:data quality: good
*The low income cut-offs after tax (LICO-AT) are income thresholds below which a family will likely devote a larger share of its after-tax income on the necessities of food, shelter and clothing than the average family. The approach is essentially to estimate an income threshold at which families are expected to spend 20 percentage points more than the average family on food, shelter and clothing, based on the 1992 Family Expenditures Survey. LICOs are calculated in this manner for seven family sizes and five community sizes.
**An economic family refers to a group of two or more persons who live in the same dwelling and are related to each other by blood, marriage, common-law, adoption or a foster relationship.
Source: Table 11-10-0135-01 Low income statistics by age, sex and economic family type.
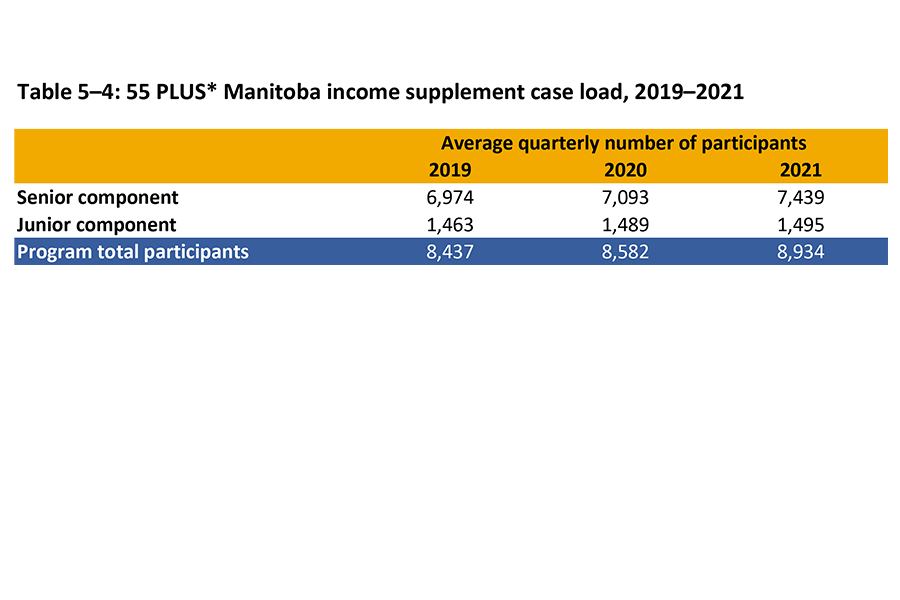
Download file
Income supplement 55 plus(PowerPoint)
* 55 PLUS is a Manitoba Income Supplement that provides quarterly supplements to low-income persons 55 years of age and over. The 55 PLUS program has two components. The Senior Component is for persons who are eligible to receive certain levels of benefits under the federal Old Age Security programs. The Junior Component is for low-income persons 55 years of age and over who are not eligible for federal Old Age Security benefits. Eligibility for the Senior Component is determined from a person’s application for the federal Guaranteed Income Supplement. An annual application is necessary for the Junior Component.
Government of Manitoba, 2021. Manitoba Families Annual Report 2020-2021. (p. 49)
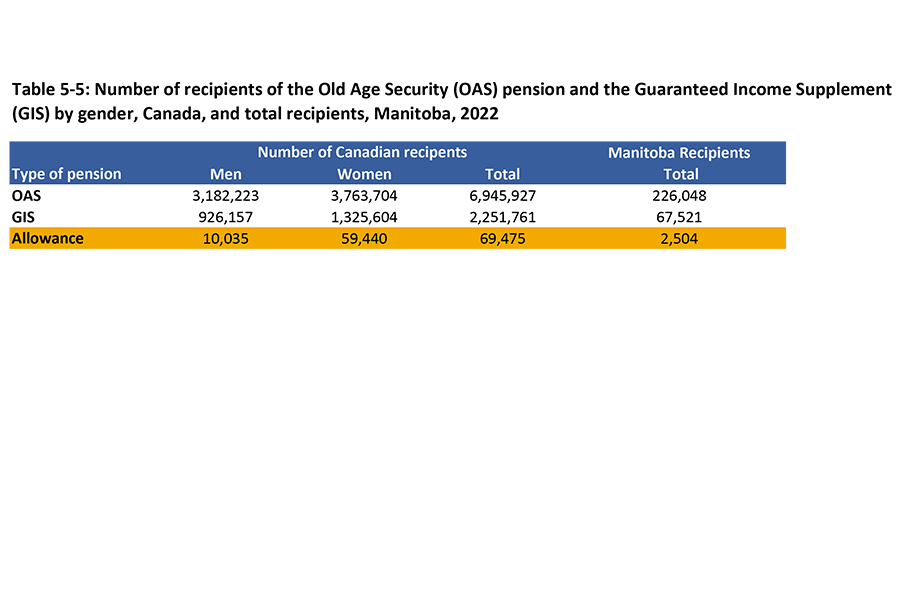
Sources of income
Download files
Pension supplement (PowerPoint)
Employment and Social Development Canada, November 2016. Old Age Security (OAS) - Number of Persons Receiving OAS Benefits, by Province and by Type. Record ID: 77381606-95c0-411a-a7cd-eba5d038c1c4.
Employment and Social Development Canada, October 2016. Old Age Security Program (OAS) - Number of OAS recipients by type and gender. Record ID: 6268b894-5ae7-4203-9ded-131fc872313f.
Download file
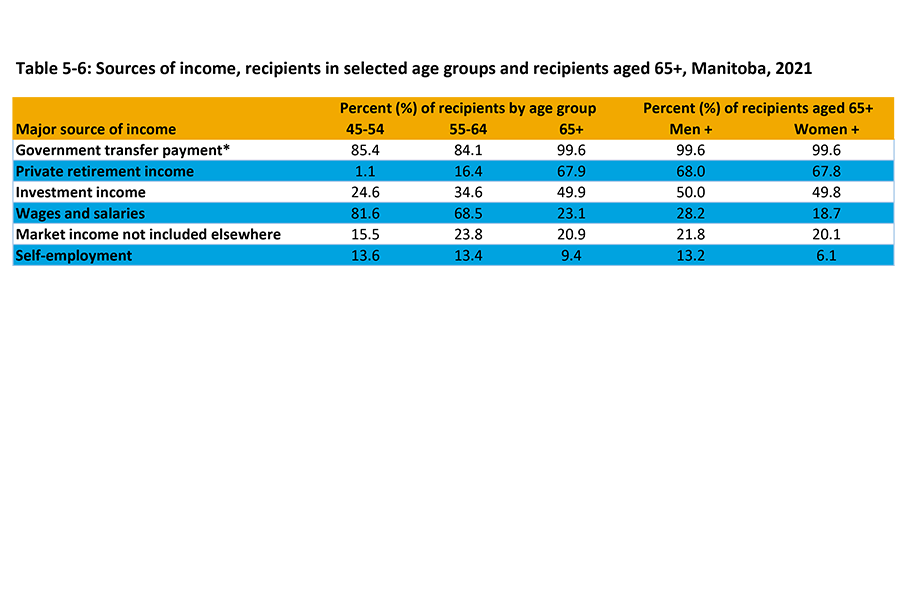
Income source age 45 and over (PowerPoint)
*Government Transfer Payments includes provincial, territorial or municipal social assistance, benefits from Canada Pension Plan (CPP) or Quebec Pension Plan (QPP), Guaranteed Income Supplement (GIS), Old Age Security (OAS), Employment Insurance (EI), Canada workers benefit (CWB) and other income from government sources.
Source: Statistics Canada. Table 98-10-0068-01 . Income statistics for detailed income sources and taxes by age and gender: Canada, provinces and territories, census metropolitan areas and census agglomerations with parts
Download file
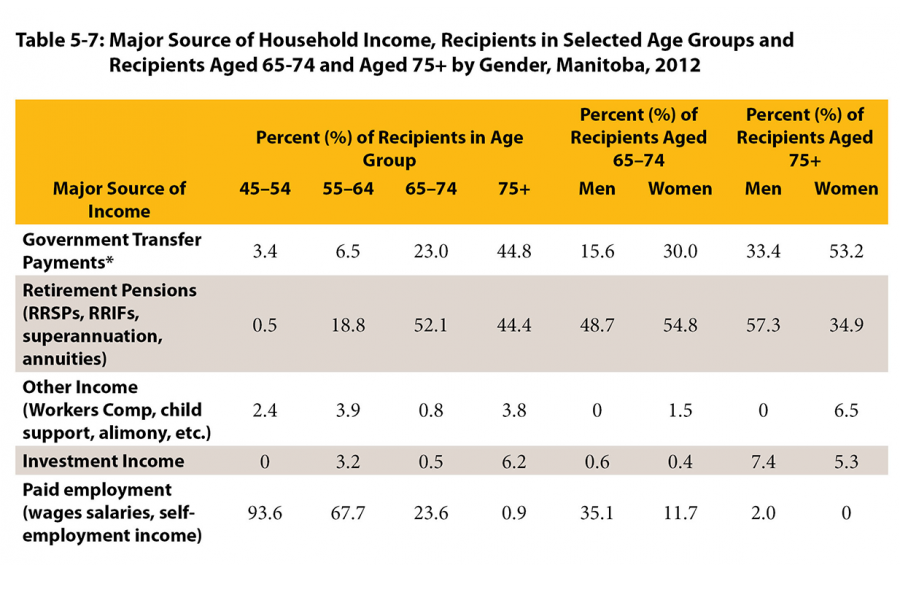
Major source of income (PowerPoint)
*Government Transfer Payments includes provincial, territorial or municipal social assistance, benefits from Canada Pension Plan (CPP) or Quebec Pension Plan (QPP), Guaranteed Income Supplement (GIS), Old Age Security (OAS) and Employment Insurance (EI)
Note: Due to a small sample size Government Transfer Payments for men do not include Guaranteed Income Supplement (GIS)
Source: Statistics Canada, 2012. General Social Survey - Caregiving and Care Receiving, Public Use Microdata File.
Home ownership
Download file
Source: Statistics Canada, 2017. Survey of Household Spending, Public Use Microdata File.
Download file
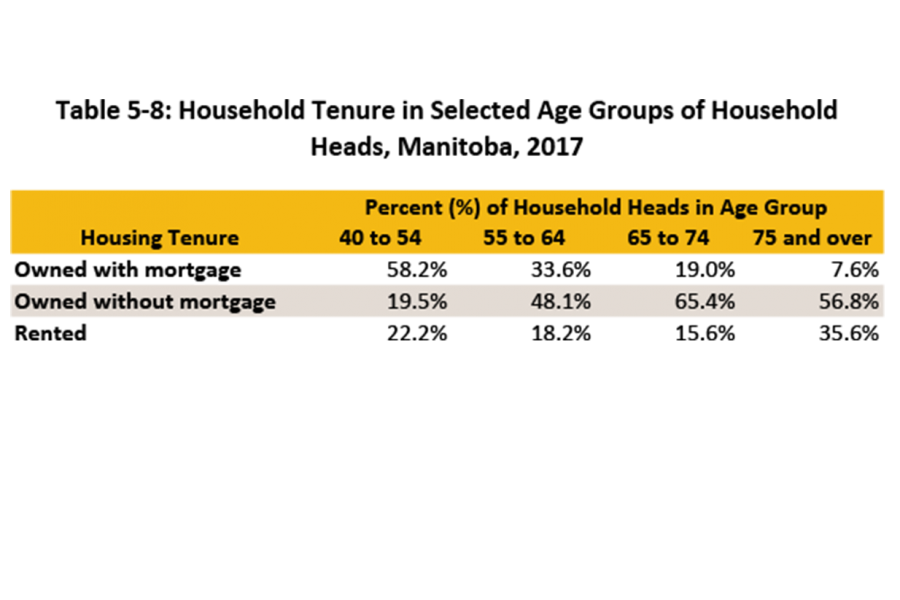
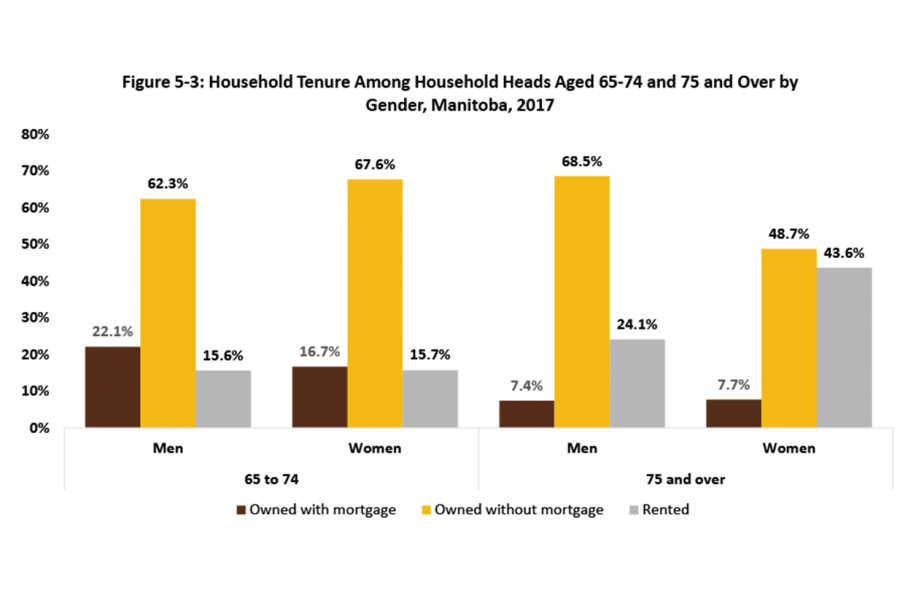
Household head housing tenure (PowerPoint) | Household head housing tenure (Excel)
Source: Statistics Canada, 2011 National Household Survey, Public Use Microdata File.
Manitoba Government assistance
Download file
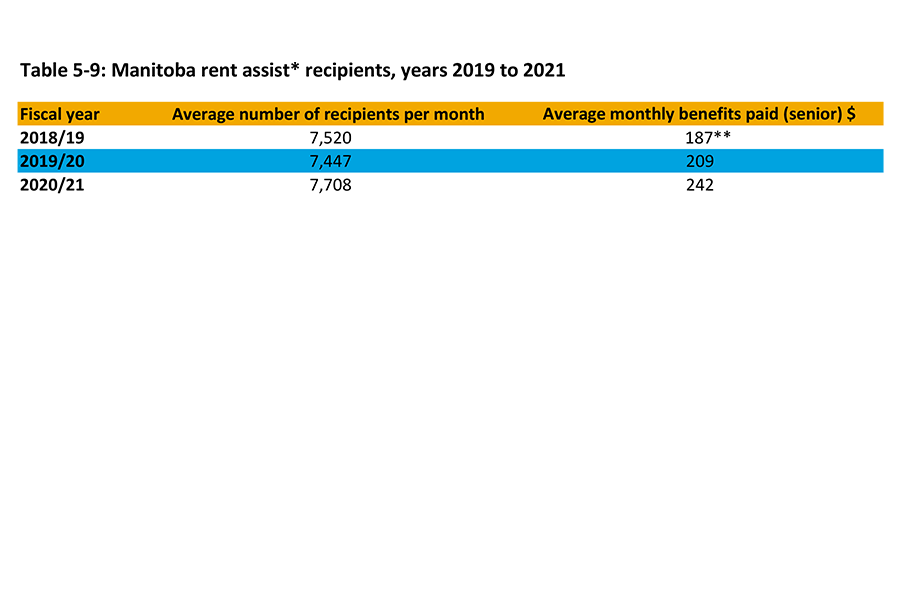
Rent assistance to 2021 (PowerPoint)
*Rent Assist provides financial help with shelter-related costs for Manitobans living in eligible accommodations. For EIA program participants, this assistance is included as part of the EIA households’ total monthly income assistance.
**Averages for 2018/19 calculated excluding June due to a batching issue.
Source: Government of Manitoba, 2021. Manitoba Families 2020-2021 Annual Report (p. 49).
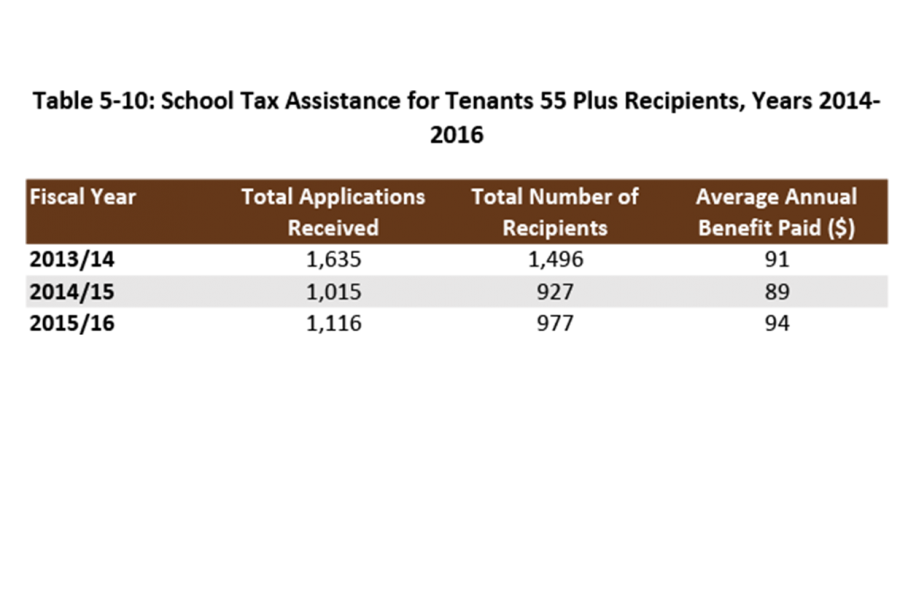
Download file
School tax assistance (PowerPoint)
Source: Government of Manitoba. 2016. Manitoba Housing and Community Development 2015–2016 Annual Report.
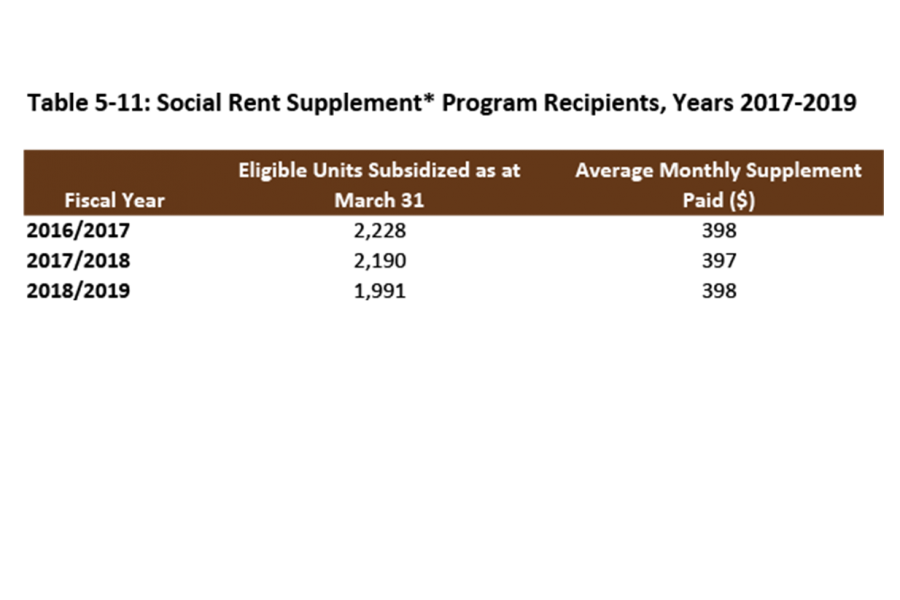
Download file
Rent supplement 2017-2019 (PowerPoint)
* The Rent Supplement helps low-income families, older adults, and special needs households obtain affordable, adequate and suitable housing in the private rental sector and in non-profit affordable housing initiatives. The provincial government entered into agreements with private landlords, non-profit and cooperative housing projects to deliver both the Social and Affordable Rent Supplement Programs, so that eligible households are provided a rental benefit based upon their income.
Source: Government of Manitoba. 2019. Manitoba Families 2018–2019 Annual Report (p. 107).
Spending patterns
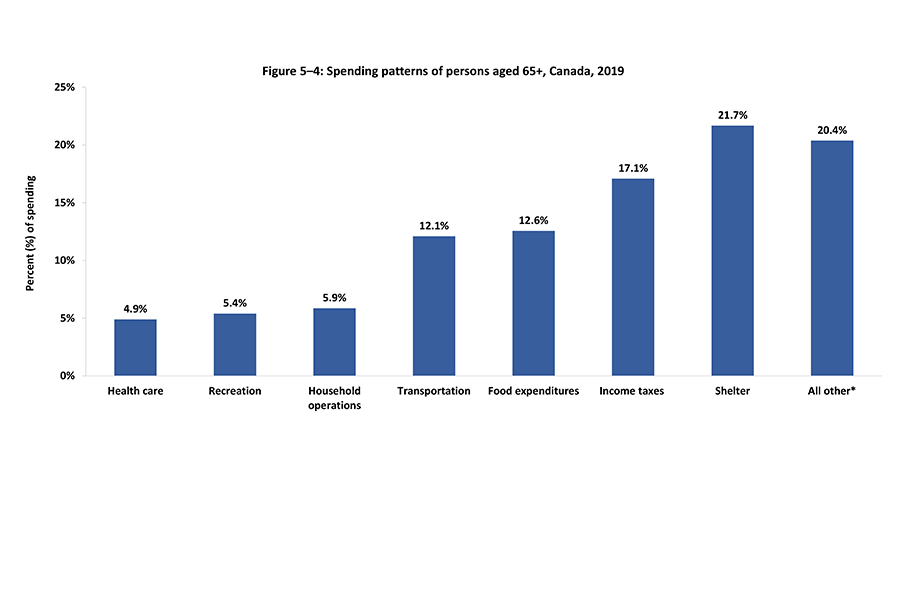
Download file
Spending patterns (PowerPoint) | Spending patterns (Excel)
*All other includes education, reading materials, tobacco and alcohol, games of chance, personals insurance and pension, gifts and charity, personal care, household furnishings and equipment, clothes and accessories and other miscellaneous expenditures.
Source: Statistics Canada 2021. Table 11-10-0227-01 Household spending by age of reference person.
Housing
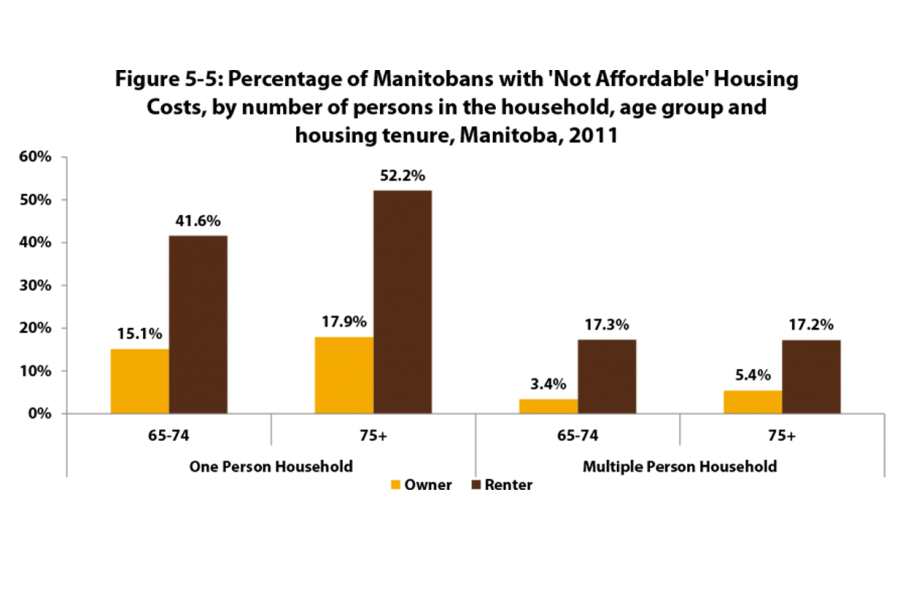
Download file
Not affordable housing (PowerPoint) | Not affordable housing (Excel)
Source: Statistics Canada, 2011 National Household Survey, Statistics Canada Catalogue no. 99-014-X2011028.
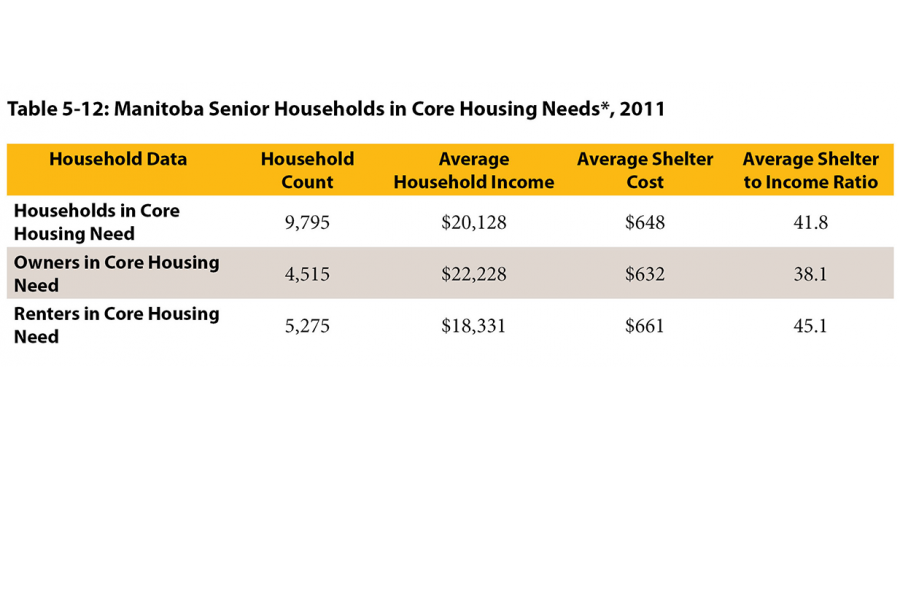
Core housing
Download file
Core housing needs (PowerPoint)
*A Household is in Core Housing Need if its housing does not meet one or more of the adequacy, suitability or affordability standards, and it would have to spend 30% or more of its before-tax income to access acceptable local housing. Canada Mortgage and Housing Corporation, 2016 Retrieved from www.cmhc-schl.gc.ca/en/hoficlincl/observer/observer_044.cfm
Source: Canada Mortgage and Housing Corporation (CMHC), 2011
Source: Data for this table was extracted from the Canada Mortgage and Housing Corporation (CMHC) Beyond 20/20 Web Data Server. Retrieved August 4, 2016
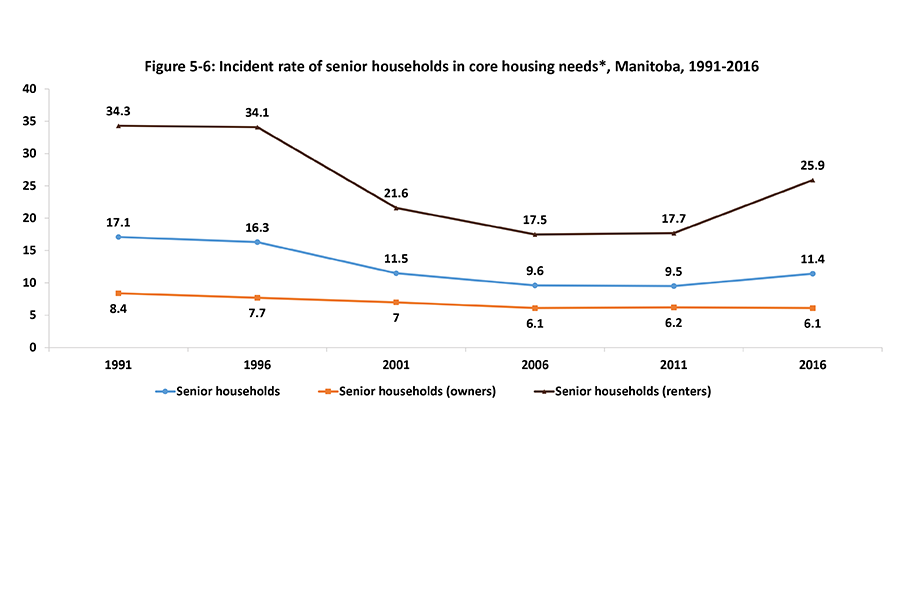
Download file
Incident rate core housing (PowerPoint) | Incident rate core housing (Excel)
*A Household is in Core Housing Need if its housing does not meet one or more of the adequacy, suitability or affordability standards, and it would have to spend 30% or more of its before-tax income to access acceptable local housing.
Source: Canada Mortgage and Housing (CMHC), 2016
Data for this table was extracted from the Canada Mortgage and Housing Corporation (CMHC) Housing Market Information Portal.