2250Z
2300Z
2310Z
2320Z
![]()
![]()
![]()
![]()


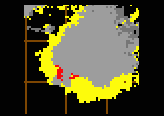
(gradient ³ 10 dBZ/km)


BWER in red,
overhang in yellow,
precipitation cores in grey.


2250Z |
2300Z |
2310Z |
2320Z |
||
| A |
|
|
|
|
Vertical cell profile view |
| B |  |
 |
 |
 |
Reflectivity Gradient view (gradient ³ 10 dBZ/km) |
| C |  |
 |
 |
 |
BWER/WER output BWER in red, overhang in yellow, precipitation cores in grey. |
| D |  |
 |
 |
 |
VIL density |
| E |  |
 |
 |
 |
Height of Max_R |
| F |  |
 |
 |
 |
Wind Gust Potential |
| G |  |
 |
 |
 |
Echo Tops |
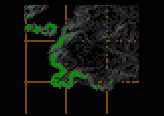
Figure 7: Contoured output of selected RDSS products at 10-minute
intervals from 2250 UTC
to 2320 UTC 24 July 2000.
Vertical profile: light green is 44-49 dBZ, yellow 50-55, orange 56-61, red 62-67, fuschia 68-73, flesh pink 74-79, and white ³ 80.
VIL density: < 1 g/m3 is white, 1-2 is green, 2-3 is yellow, 3-3.5 is orange, 3.5-4 is red, 4-4.5 is fuschia and > 4.5 is white.
Height of the Max_R: green is 6-9 km, yellow is 9-12, orange is 12-15, and red is ³ 15 km.
Wind Gust Potential: blue < 20 km/h, 20-40 is green, 40-60 is yellow, 60-80 is orange, 80-100 is red, 100-120 is fuschia and white is ³ 120.
Echo Tops: red is 13 km, fuschia is 14, light pink is 15, and white is ³ 16 km.